Football is a game defined by goals. Since the Ballon d'Or was created in 1956, only one goalkeeper has won the award, and only a handful of defenders have (none since Fabio Cannavaro in 2006). Clearly, strikers are the ones who capture the public's imagination: it is much easier to appreciate a powerful long shot than a collective step-up by a defense to create an offside trap, for instance. But are shots so black and white? Is it as easy as it seems to determine the difference between a 'good' shot and a 'bad' shot? Increasingly, football analysis has evolved in an attempt to quantify the most important part of the game: goalscoring.
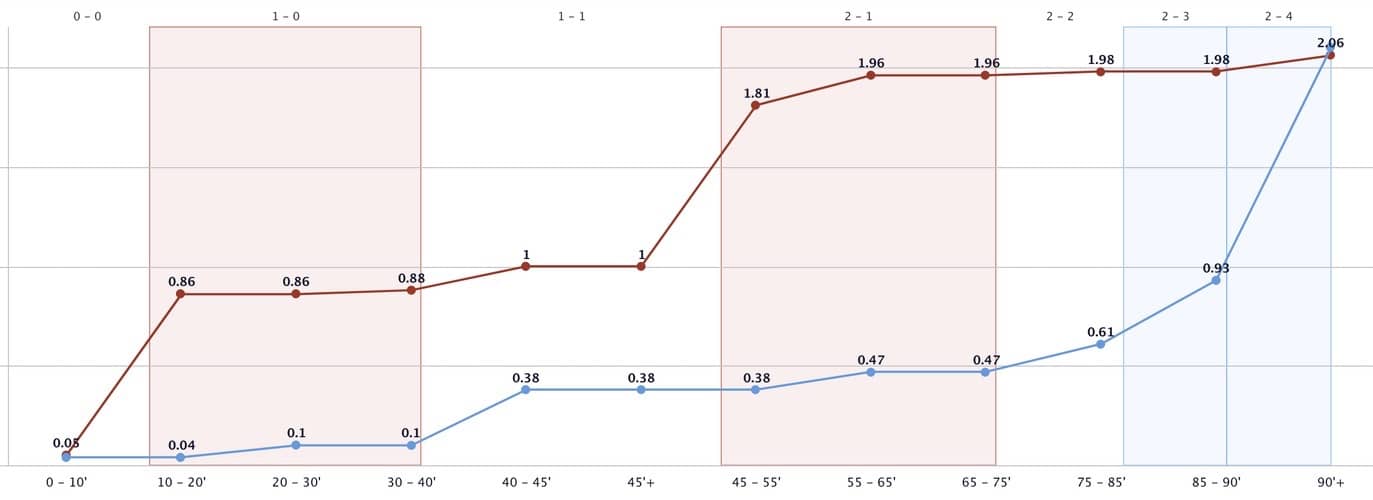
By now, football lovers and those who work in the game will have heard of Expected Goals (xG). It has risen from a niche metric used by analysts to a common tool for elite managers and an integral feature for TV broadcasters, and heralded the arrival of data analytics in the mainstream. Expected Goals measure the likelihood of a chance being scored depending on where it was taken on the pitch. By collecting thousands of examples of previous shots, xG can quantify fans and pundits' instincts about which chances are more or less likely to be scored.
Originally just taking into account static variables like distance and angle to goal, xG has now evolved to incorporate what body part was used to shoot, whether the player was under pressure from defenders and the pattern of play leading up to the chance, and more. At Footovision, we are uniquely placed to offer an extremely accurate model of xG for two reasons.
Firstly, we extract all of our data from TV broadcasts, meaning we own the footage and can use thousands of past instances of shots & goals to combine the variables and outcomes of all shots in our database. Secondly, we track ball and non-ball events, so other statistics providers who only track ball events (i.e. speed of passes leading up to the shot) will never be as accurate as our model which accounts for important off-ball variables like defenders' positions.
Always striving to improve the depth of analysis we offer to our clients, last year Footovision introduced the latest craze in data analytics, the Post-shot Expected Goals metric, onto our dashboard. But what is this new and improved analysis tool? Despite the complicated name, the difference is quite simple. PSxG takes into account what happens to the shot when it has left the shooter's boot. Two shots taken in the same location in similar circumstances will have near-identical xG values, but they will have different PSxG values based on the quality of the shot itself. This is an important evolution, because just like goals scored does not paint an accurate picture of a football match, the xG metric had regressed to equating winning a game 'on xG' to deserving to win that game. Players, coaches and fans could hide behind their team's xG value which ignoring their poor finishing (i.e. where the players generally aim their shots).
So how does Footovision use the Post-shot Expected Goals metric to assess whether the decisions a player makes increase their chances of scoring? Shots are separated on the dashboard into different types: headers, shots in the box, shots at the end of a counterattack, etc.
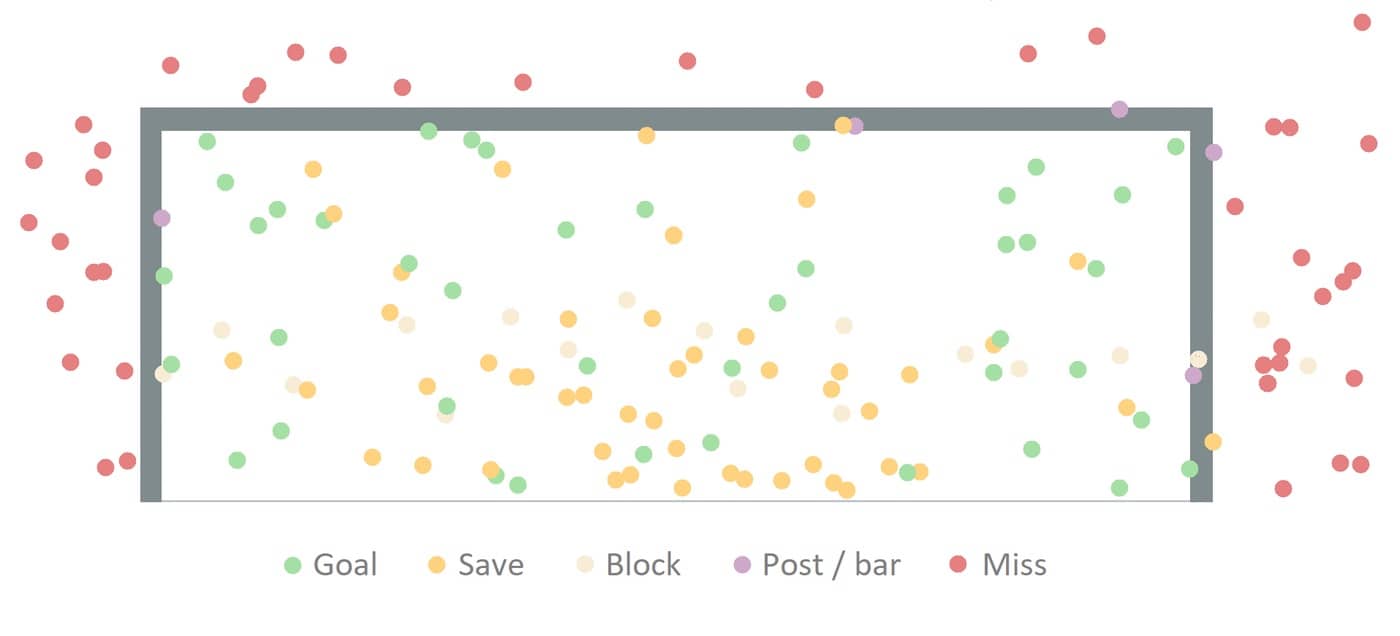
On this graph, goals are represented by green circles, saves are orange, shots which hit the woodwork are blue and shots off target are red. Thanks to this differentiation, an exhaustive list of the chances created over the course of a single match, specific competition or even season can be made. Moreover, we have added an xG filter to display the xG directly on the graph. The dots are now visualized as small pie charts: the larger the shaded wedge, the higher the xG (see below). If a circle is completely full, the shooter would be expected to score 100% of the time from that position.
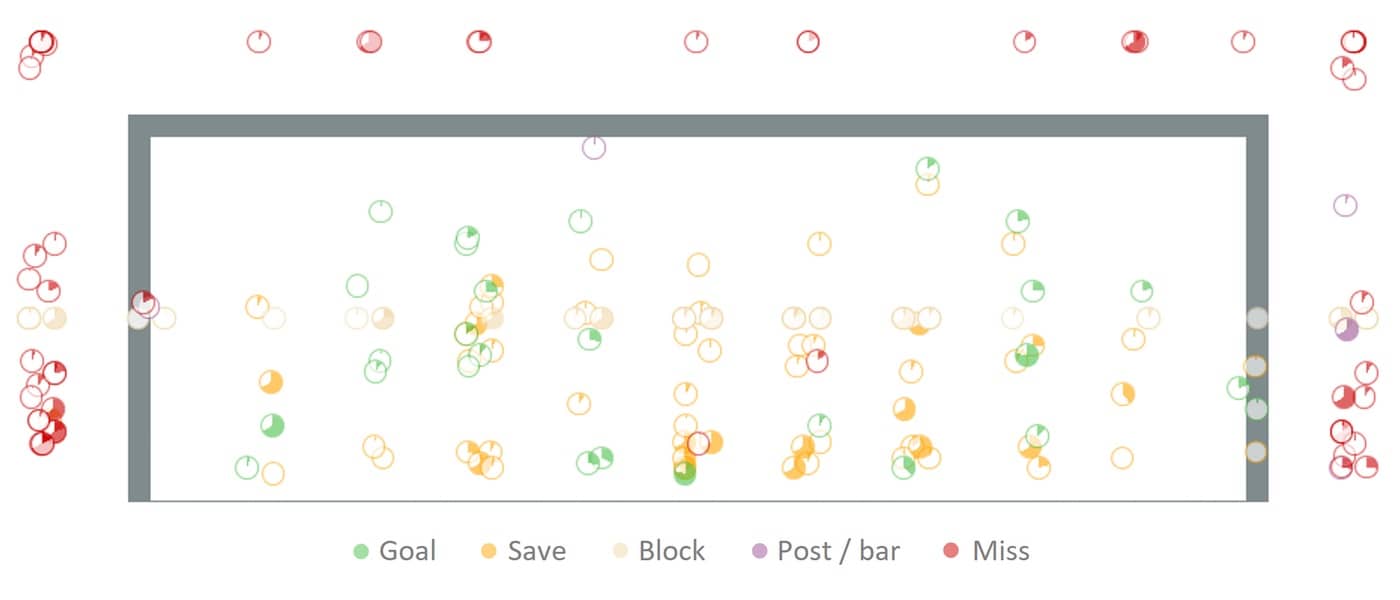
An important part of the PSxG metric is the position of the goalkeeper, so we are working hard at Footovision to make it possible for users to click on a circle and see where the goalkeeper was placed when the shot was taken. This will help to visualize whether the player made the correct choice in shooting where he did. As for now, users can also divide the goal into a grid, and display statistics for each zone.
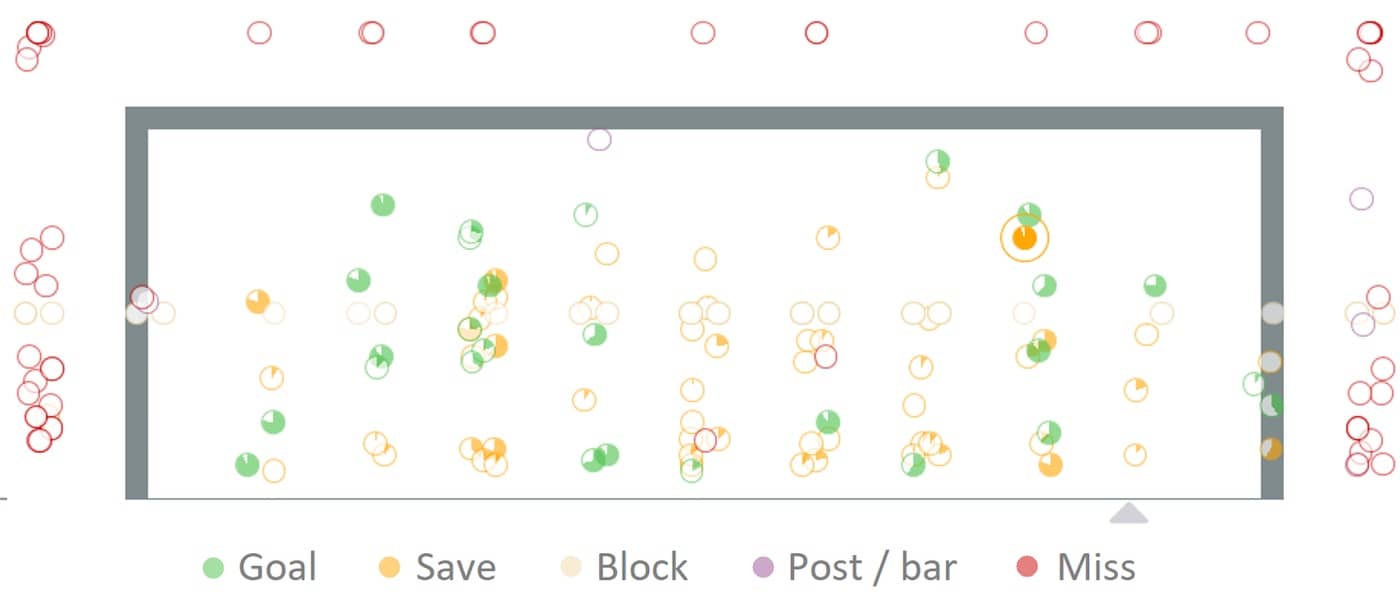
We can therefore observe by zone:
- The number of shots
- The shots by type (goal / save / miss)
- The percentage of shots from inside/outside the box
- The save percentage
- The expected goals (xG)
- The post shot expected goals (psxG)
Through all these indicators, it is possible to create a holistic report on the performance of players in front of the goal. Most importantly, this detailed metric is made accessible to all users of the Footovision dashboard by little touches like a color gradient for every grid zone, where users can choose the indicator they want visualized based on the aggregation of shots on goal (in the screenshot below, xG is highlighted).
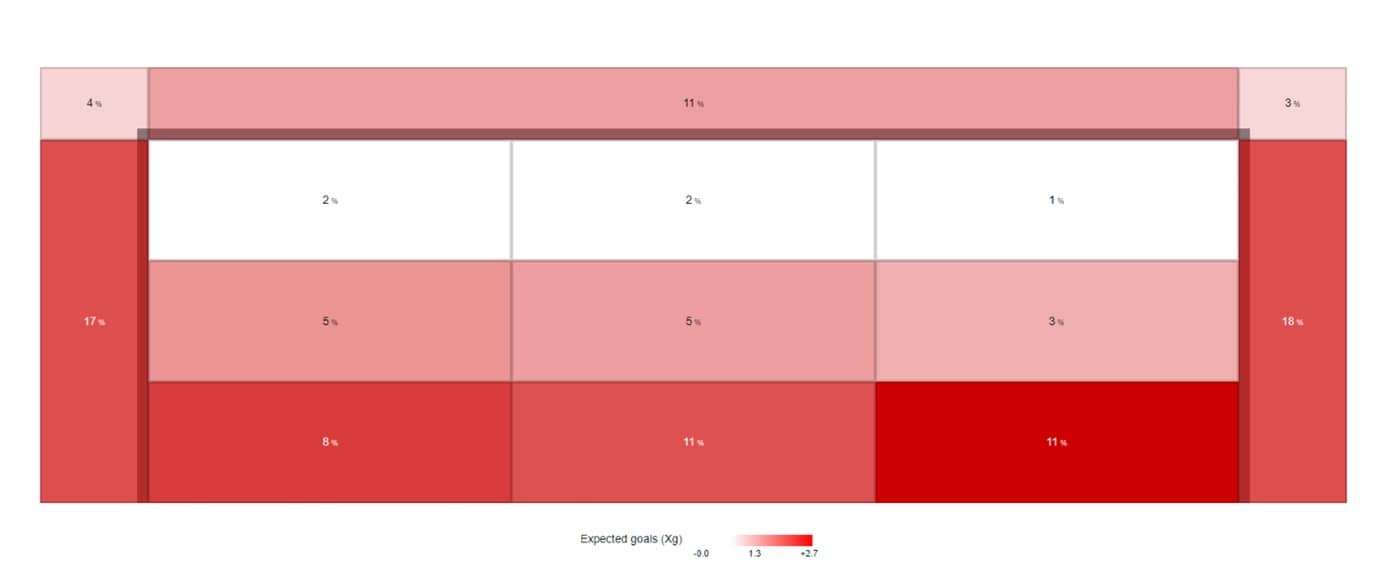
To facilitate UX even further, it is also possible to display the xG, PSxG and the position of the goalkeeper simply by clicking on a shot in any game on the platform.
By no means is PSxG a replacement for xG, but it certainly gives a greater indication of performance in players who shoot a lot (normally strikers and attacking midfielders). Comparing a player's PSxG with their xG gives an immediate indication of whether they are over or underperforming based on the quality of their chances. Players like Harry Kane, Mohamed Salah and Erling Haaland all have higher PSxG than xG values.
As well as displaying where a player shoots most often, and therefore whether these areas are effective or ineffective, the PSxG can be used to evaluate the performance of goalkeepers. For example, by combining all shots a goalkeeper faces over the course of a season, we can see the zones where the keeper concedes more or less than he should.
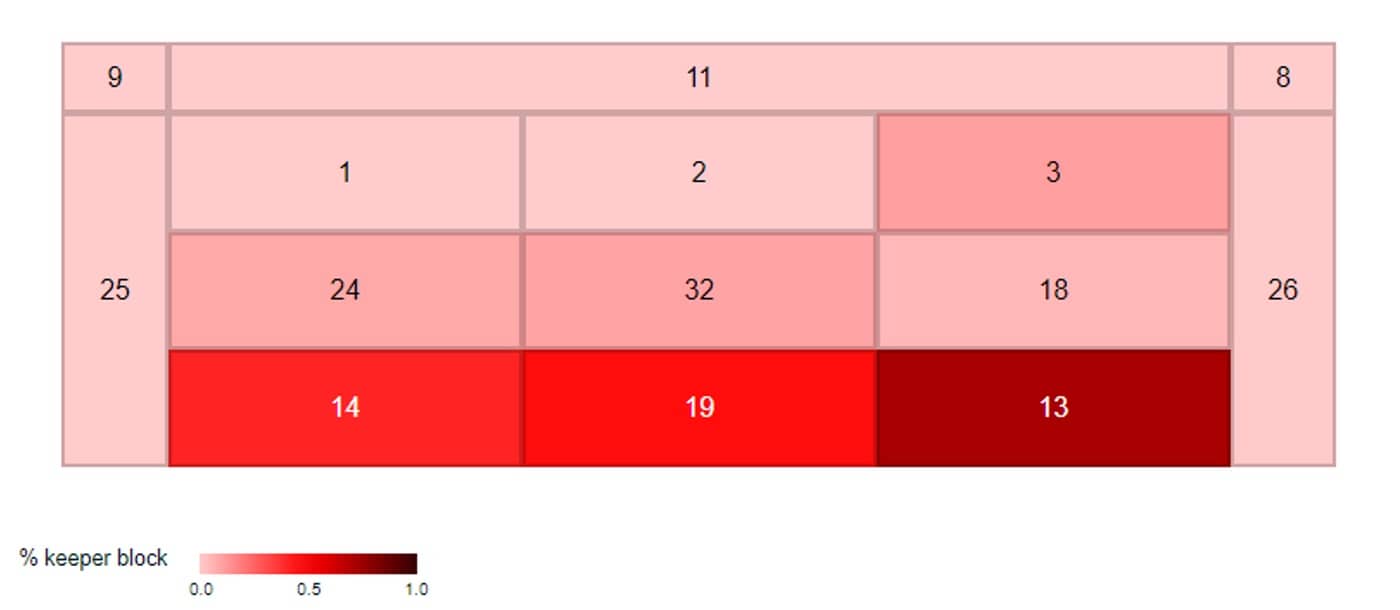
For instance, if a keeper concedes a high percentage of shots in the bottom right corner, it is hard to blame him as we would instinctively say that these shots are well-placed. However, with our widget, we can see exactly where these shots come from, so if the shots that go in the bottom right corner originate mostly from a tight angle on the right side of the six-yard box, it becomes clear that the keeper lets in too many shots at his near post, which goalkeepers are always told to cover as a priority. By factoring in the quality of the shot taken rather than the quality of the opportunity, a goalkeeper's ability can be judged, like strikers, by comparing the difference between their goals conceded and the PSxG of the chances they face.
Such is the PSxG's power in evaluating strikers' and goalkeepers' performance, we at Footovision decided that it would only be logical to create two new indicators to measure exactly that. New to the platform in 2022 are:
- Post-shot Expected Goals Saved (PSxGS) measures the difference between PSxG and xG conceded (i.e. how many likely goals have been prevented by a goalkeeper's save)
- Post-shot Expected Goals Conceded (PSxGC) measures how many likely goals have been faced by the goalkeeper based on shot information (including most importantly the resulting position of the ball)
Combining these new indicators with nearly 1000 others on the Footovision platform, users will obtain a complete picture of the quality of scoring chances and what they mean for the complexion of football matches as a whole. For an analyst who wants insight on their own team's forwards and goalkeeper as well as their opposition's, these widgets provide a key strategic advantage before any decisive fixture.
