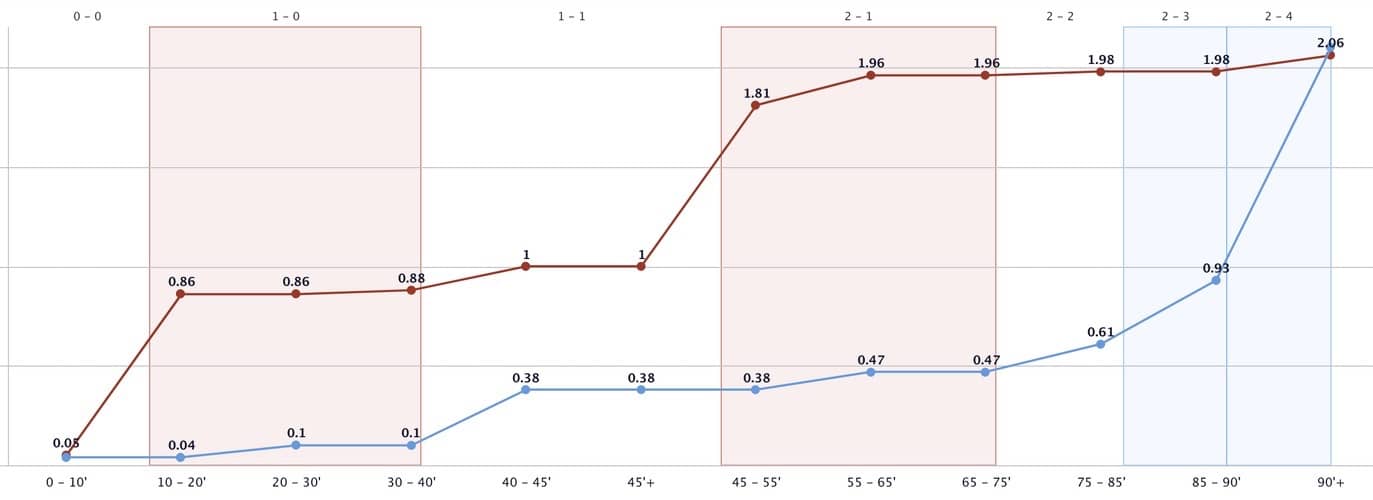
The Expected Goals metric measures the quality of a shot based on several variables. The nature of the assist, shot angle and distance from the goal, and whether it was a header, volley, or first-time finish all determine whether a shot is deemed a 'big chance'. By adding up a player or team's expected goals, it gives us an indication of how many goals a player or team should score on average, compared to how many goals they actually scored. In football, many more shots and chances are created than goals scored. Therefore, a goal is a rare event (an average of 2.5 goals are scored per game), the number of goals scored in the game does not necessarily provide us with enough data to properly assess who deserved to win.
This brings the xG model into the picture. This model emerged in the USA in the 1990s through sports like baseball, basketball and American football. The characteristics which determine an xG, for instance, are the angle, distance, or power behind the shot. Whilst xG is a calculated average chance of a shot being scored, a team or player may outperform or underperform their xG value! Players can score from a chance that on average a player would be expected to miss, or vice-versa.
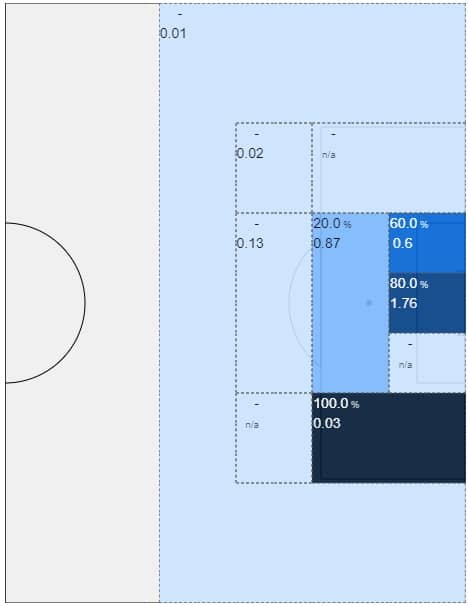
How does this model work?
By exporting all shot data that we have in our database (mostly from top European leagues), we can frame each shot in the context of additional information like the position of the shooter, goalkeeper, and which body part was used to score the goal. At Footovision, we then build the xG model translating all this data into Python. Python is a prominent level programming language which, when combined with an algorithm which uses machine learning (the 'Neural Network') creates an accurate and complete account of the number of expected goals. The xG model is often used to analyze various scenarios and is crucial for:
- Bookmakers and betting companies to generate and set the odds of an upcoming game and in real-time.
- Assessing a team/player's “true” or “actual” performance in a match or through an entire season, without focusing on current form.
- Providing a clear indication on the number and quality of chances being created regardless of the final score.
- Identifying in form players: players who are outperforming their teammates or players who are not getting enough playing time based on the quality of their team.
- Analyzing the effectiveness of the defence by seeing clearly whether they are conceding too many goals for the quality of chances they concede.
- The scouting of players using specific parameters.
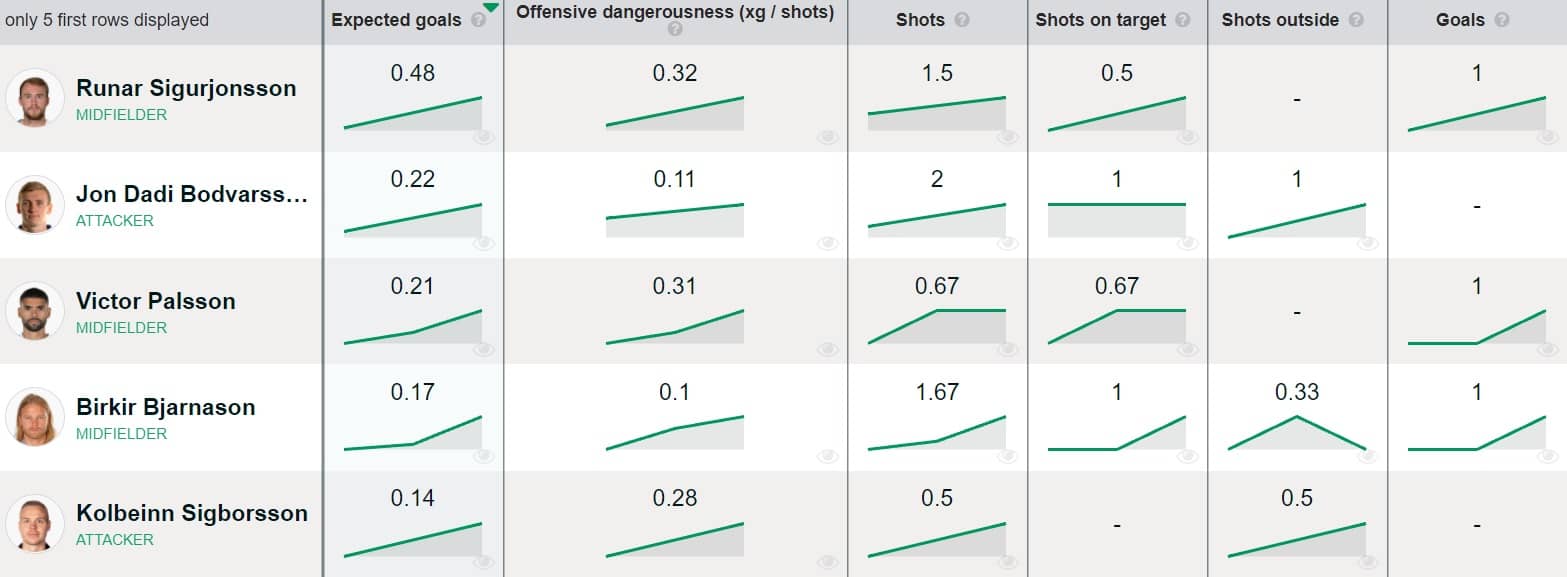
What once was a technical term used by analysts has now become a global metric, integral to many broadcasters' live feeds. It is increasingly common to see 'xG' below 'possession', 'shots on target' etc. in the list of statistics at half time. The template is growing too: don't be surprised if pundits and commentators start talking about xA (expected assists) or xT (expected threat) in the near future!
